

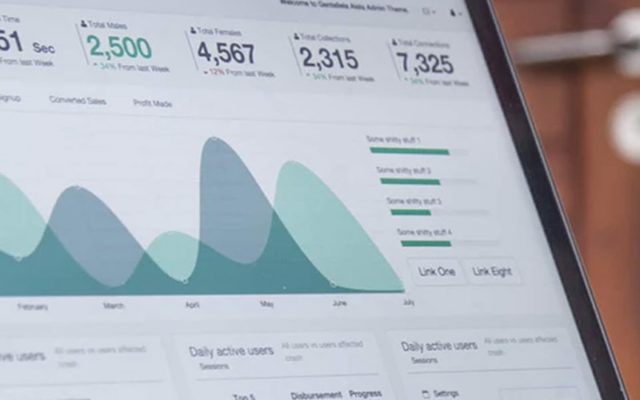
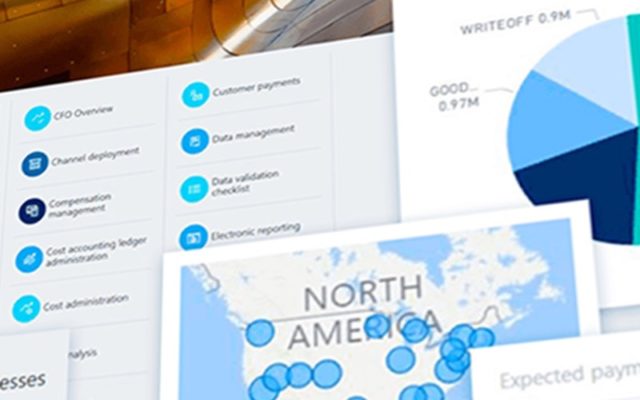
An important aspect of dashboards and analytical UI creation is visualization of data. BI companies and audit firms hire experts to choose the right chart/visualization to depict the data. And this requires a variety of data visualizations at their disposal. Right from simple bar, line and stack charts to advanced ones.
Javascript is powerful. Different browsers handle it differently but there are 2 major ones, Google’s V8 and Mozilla’s SpiderMonkey. Javascript has evolved from its use on simple visual animations to advanced data processing, graphing and charting. Libraries make it easier to work with Javascript, some well known ones are jQuery, Angular, Vue. Over my professional career I had developed my own Javascript library due to weighed pro’s and cons of off the shelf ones. This was generally used by me and my team for creation of digital marketing templates, dashboards and JS widgets. It had been updated, modified over the years for newer uses, functionalities with device fallbacks, browser handling. I prefer use of SVG over canvas for charting, graphs and many of the custom library functions deal with SVG creation, manipulation & event handling. We have successfully deployed complex circular menus with SVG on our dashboards & graphs and it worked fabulously on mobile and android devices.
Off the shelf Javascript charting libraries are numerous lately and it all depends on its use and applicable license. Closed source, proprietor libraries are difficult to deal with especially when customizations comes to play. Although libraries like Highcharts, Telerik and others offer ease of use, deployment and parameter based customizations. If you need something more than what the chart can do, you need to file a feature request and it would be the companies decision when it gets implemented and if it ever will. Open source charting libraries like d3 are pretty popular but are difficult to work with. Customizations are endless and if you don’t know to stop you may end up having another library on top of d3.
I have worked with many of these libraries over the past and used it on different projects for different reasons with different teams. In fact, there was a time when such libraries were scarce and under featured/documented and we had used my bar/line/stack library that had advanced functions allowing drag select and summarize options.
I’ll update some of my analytical graphs, libraries on this post. Until then, stay tuned…
