

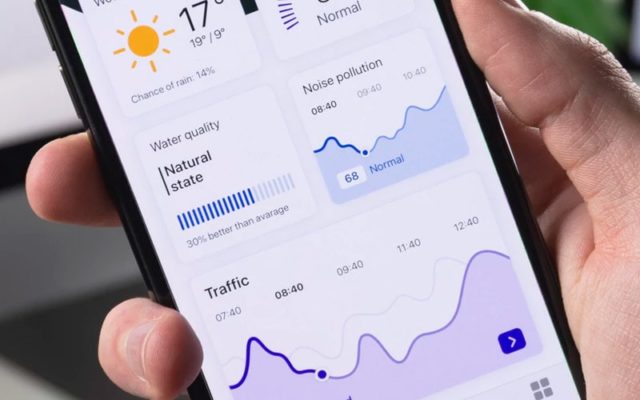
The post deals with my personal experiences on projects involving Analytics, Dashboards, Business Intelligence. It describes why analytics is important to companies and where popular tools available in the industry excel at. One of the projects that gave me and my team good exposure in this field was a PWA based custom Analytics platform. The tool generates responsive dashboards that helps visualize data received from any source database/ERP system and is capable of showing it on mobile devices as well as board room projectors. Feel free to read the post and comment your questions or feedback below.
Business Intelligence is in the spotlight lately for companies due to ready offerings like Power BI and Tableau. Analytics is now key for companies since competition, risk, volatility, margins on vendors, manpower, faculty, logistics play a exponential role in revenue due to socio-economic situations today. The market/industry is cut throat and monitoring key numbers and figures in a timely manner is crucial for a company’s success and it has to be done on every level from Top Management to Project Managers, Team Leads. Flying blind on luck is not affordable anymore.
Companies are now able to visualize their data and gain insight about their team, department, branch, outlet, subsidiary, company like never before. A lot of work goes into getting the data from various sources into a clean workable format for these Analytical tools & dashboards. Companies generally use a variety of software packages and each differ in their database, api’s and each have a way to allow connections to underlying data. Various teams, department, functional groups in the organization work on different applications and software which differ in their database and complexity.
I personally have worked with Power BI and Tableau recently and I find the Microsoft offerings quite attractive as they provide a complete corporate platform for a company to function. This becomes especially true if your company works on the Microsoft platform. Azure, Dynamics and other Microsoft offerings are pretty instant to connect on Power BI and easy to clean / manipulate the data. None the less you can manage to connect data from any valid SQL source or even JSON/HTML table data. One of the difficulty I experienced with Power BI is the lack of off the shelf / market visualizations. Although developers are free to create their own R (a new query visualization language) visualization, I feel HTML/JS/PHP/Node based solutions excel in this area, there is too many visualization options and flexibility on the Web platform preventing these native tools/languages to easily take away the crown.
Over my career I had worked for Managements Eye, a company situated in Ashok Nagar, Chennai, India. a subsidiary of Brisk Corporate Services which had created and introduced a new Analytical Tool in the BI market back in 2015. At the time versatility to connect and showcase data from any source database was of key importance as most tools weren’t able to do so and we had created a tool which excelled at that. The templates our team had developed were responsive, mobile friendly and it was what today’s web industry calls a “Progressive Web App“.
A Progressive Web App or PWA’s are web sites or web applications deployable on mobile devices. They do not require extensive changes on the base application as the functional visual interface is a website or a web application. This offers flexibility to change, update, improve UI/UX on the fly, introduce new visualizations, features, navigation overnight without the client having to update their mobile apps. Care has to be taken to prevent loading delays and device caches have to be used wisely for a seamless native app feel.
We did’nt have the fancy name of PWAs back then. The dashboards, business intelligence apps we had developed on Apache Cordova worked in that exact PWA fashion. We used a variety of visualization tools from D3, Highcharts to in-house canvas & svg based charting libraries. Our in-house charting libraries gave us an edge over other to showcase unique data visualizations on our clients mobile devices, helping them gain critical onsite data inn a timely manner.
Hope you have enjoyed this topic, do share comments below. I will try to moderate and reply as soon as possible. Have a nice day !

